Givens Control Engineering Inc.
Graphing & Analysis, Control Simulation, Profile Analysis, PID Tuning Software; Control Engineering Services
Getting Data Out of Analyse-Plus
There are 4 main ways to get data out of Analyse-Plus:- Export To Text
- Copy to Clipboard
- DDE Send
- DDE Server
Export To Text
Export To Text is a tool for sending data to other applications. It creates generic (text) files containing sampled data in text (ASCII/ANSI) form. Typically you would import them into another program that does some kind of special processing that Analyse-Plus does not. The samples of each variable (data file) will be equally-spaced in time. Each file can have its own sample period though.
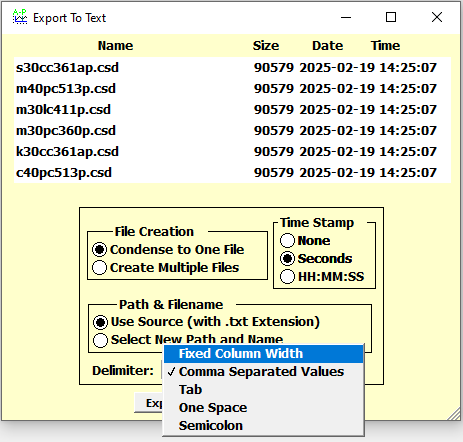 The screenshot at left shows the Export display where you choose the export options, having
already selected all the files you want to export from the Quick List.
You can choose what kind of Time Stamp you want (or none) and whether you want all the samples
to be saved to a single file (with multiple columns if there is more than 1 data file).
The Path & Filename selection allows you to choose the exported filename(s) or prefer this
to be set automatically (as the name of the first dat file exported, with the .txt extension).
Having the automatic setting is useful when exporting a large number of files (e.g. 100).
Choose the Delimiters (pull-down menu shown in grey) according to what the importing program
needs: Tab, Space, Semi-Colon, Comma or Fixed Width.
The screenshot at left shows the Export display where you choose the export options, having
already selected all the files you want to export from the Quick List.
You can choose what kind of Time Stamp you want (or none) and whether you want all the samples
to be saved to a single file (with multiple columns if there is more than 1 data file).
The Path & Filename selection allows you to choose the exported filename(s) or prefer this
to be set automatically (as the name of the first dat file exported, with the .txt extension).
Having the automatic setting is useful when exporting a large number of files (e.g. 100).
Choose the Delimiters (pull-down menu shown in grey) according to what the importing program
needs: Tab, Space, Semi-Colon, Comma or Fixed Width.
Like other tasks, exporting a huge amount of data in many files in the format you require
is both easy and fast in Analyse-Plus.
Copy to Clipboard
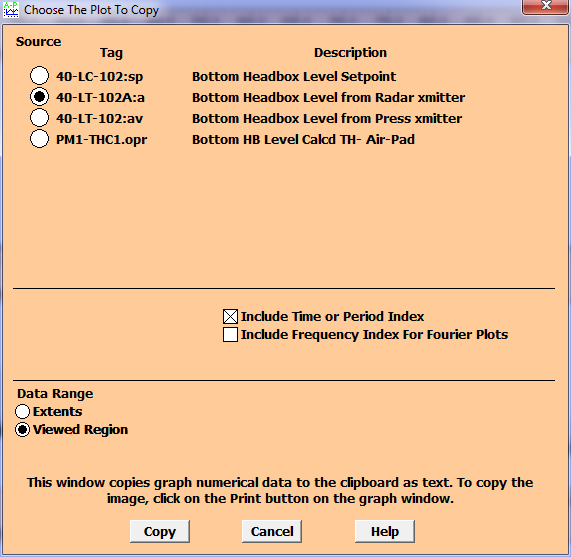 Just click on the Copy button from Separate Plot or Overlay Plot or PID Simulator or Import Text or Valmet QMM Files to Profile FCD to copy the data as text to the clipboard for pasting into other applications such as Excel etc.). For data generated from within Analyse-Plus such as from the latter two tools, you
can also copy the data to data files (.csd). The window shown at left will appear. Select the plot you wish to copy and whether you wish to have the entire plot copied (Extents) or only the Viewed Region (visible portion in the x-direction, if zoomed). Then
click Copy.
Just click on the Copy button from Separate Plot or Overlay Plot or PID Simulator or Import Text or Valmet QMM Files to Profile FCD to copy the data as text to the clipboard for pasting into other applications such as Excel etc.). For data generated from within Analyse-Plus such as from the latter two tools, you
can also copy the data to data files (.csd). The window shown at left will appear. Select the plot you wish to copy and whether you wish to have the entire plot copied (Extents) or only the Viewed Region (visible portion in the x-direction, if zoomed). Then
click Copy.
You may optionally copy the Time scale (x-axis) together with the data. For Fourier plots, this is the period. For Fourier plots only, you may also copy the frequency scale.
The format and order of the copied data is as follows:
<Time or Period 1><Tab><Frequency 1><Tab><Plot Data Sample 1><Carriage Return><Line Feed>
<Time or Period 2><Tab><Frequency 2><Tab><Plot Data Sample 2><Carriage Return><Line Feed>
..
<Time or Period n><Tab><Frequency n><Tab><Plot Data Sample n><Carriage Return><Line Feed>
<Time or Period> or <Frequency> may be missing depending on your selections.
DDE Send
DDE is a legacy technology but is still supported by Windows and works very well with Excel and other programs. It is an easy and quick way to send (or receive) data to (from)) other applications. It is quicker and easier to send a data file to a spreadsheet such as Excel than exporting and importing it.
DDE is normally used to send data between two applications running on the same computer - for example, Analyse-Plus and Excel.
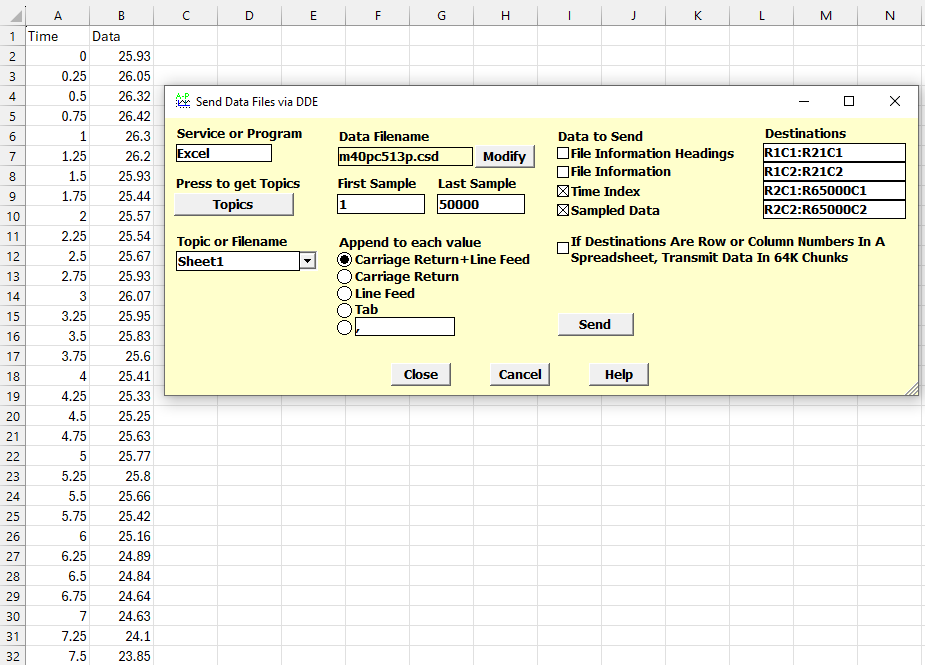 The screenshot at left shows an Excel spreadsheet and the DDE Send display together.
Here you select what you are “sending”. In this case, the user has selected the Program “Excel”,
then pressed “Topics” to get a list of spreadsheet names and tabs from Excel and then entered the
data range as Row 2 / Column 2 for the “Sampled Data” (also known as B2) to Row 65000, Column 2.
You can just enter a Row at least as large as the data you have. Then choose the Filename
from the Quick List and click on “Send”. Even large files (e.g. 100K samples) normally
only require 1-2 seconds to send.
The screenshot at left shows an Excel spreadsheet and the DDE Send display together.
Here you select what you are “sending”. In this case, the user has selected the Program “Excel”,
then pressed “Topics” to get a list of spreadsheet names and tabs from Excel and then entered the
data range as Row 2 / Column 2 for the “Sampled Data” (also known as B2) to Row 65000, Column 2.
You can just enter a Row at least as large as the data you have. Then choose the Filename
from the Quick List and click on “Send”. Even large files (e.g. 100K samples) normally
only require 1-2 seconds to send.
DDE Server
 DDE is a legacy technology but is still supported by Windows and works very well.
It is most useful when employed with DDE Receive and DDE Send.
A third DDE function, DDE Server, is available for advanced users, especially those that
customize or program other applications, automate applications or have very specific needs.
DDE is a legacy technology but is still supported by Windows and works very well.
It is most useful when employed with DDE Receive and DDE Send.
A third DDE function, DDE Server, is available for advanced users, especially those that
customize or program other applications, automate applications or have very specific needs.
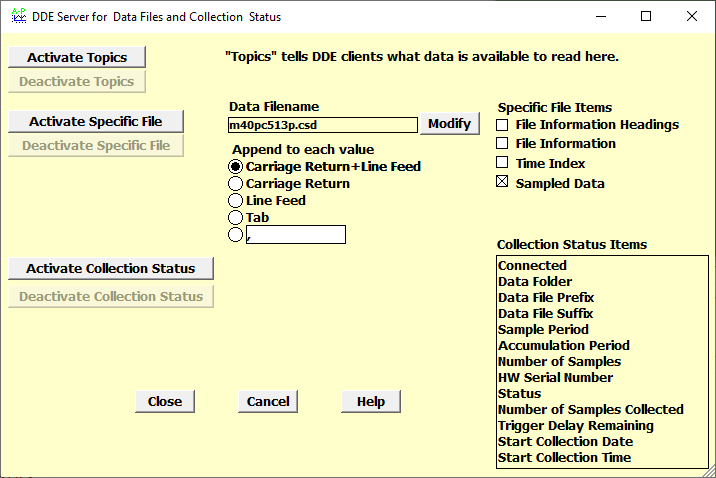
Briefly, DDE Server acts as a Server that offers data to the user’s Client through a DDE conversation (on the same computer). The data offerings are broken into 3 types:
Usually the first two types are used together. To use DDE Server, normally the user clicks on the Activate Topics and Activate Specific File buttons and then configures the Client program to request the Topics to know which files are available and to then request information or sampled data for the Specific File.
More information is available on request. The Help file contains the required information to use it.